Case Study: Can You Use Control Statistics to Improve Club Cricket Performance?
 This season, I have been conducting an experiment with a new way to measure cricket performance: "Batting Control". I have spent a whole club cricket season tracking and reviewing.
So, is control worth adding to your club and school reviews or is it one piece of data too many? Read on to find out.
What is batting control?
When is a dot not a dot?
When it's a play and miss. When it's driven hard at cover who pulls off a great stop.
What about when you edge the ball just past the keeper through the vacant slips for a boundary?
In these cases, and many others, the score itself doesn't tell you who is on top, batsman or bowler. Batting Control (BC) fills this gap with a simple stat.
Developed by the clever guys at Cricinfo, BC is measured by watching the game and deciding after every ball if the batsman was in control of the shot. A play and miss or edge behind means no control. Smashed to the fielder (or for a boundary) means control.
For this experiment, the control was kept simply to teams, rather than individuals. It was tracked by a coach watching the game and noting the outcome on an iPad after every ball.
Why use control stats?
I decided to use BC with my club this season to see if it would reveal more about our performances than the scores alone provided.
Initially I thought this would be helpful in understanding how good we were at strike rotation. If control was high but scores were low, perhaps there is a sign that we are not making the most of every delivery and defending too many balls.
But this was guesswork. Mainly, I wanted to see what happened in club games with more granular detail.
Based on what I found, I figured could build more useful and specific training plans for the team by seeing where we are strong and weak. When you only have a limited time with players, as is the case in non-professional cricket, every moment needs to be used to its highest potential. This stat was aimed to help with the mission.
What were the results?
The club played 18 matches (50 over format) in the 2016 season.
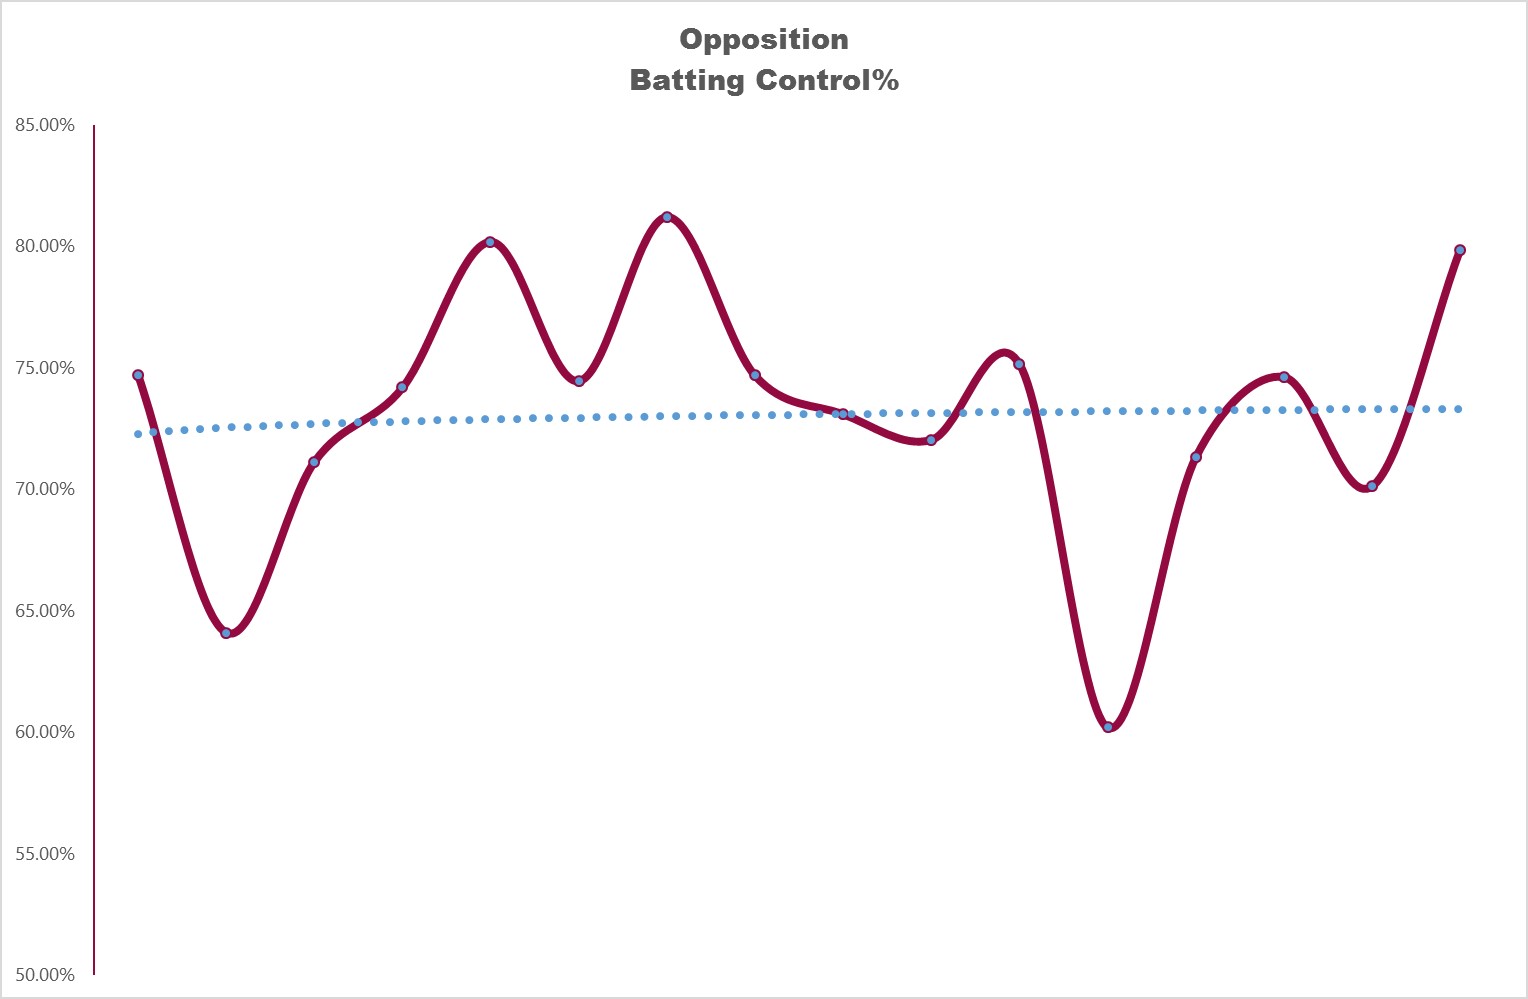
The average BC when batting was 78.40% (range 74-81%). The opposition control was 73.20% (60-81%). Click to enlarge the graphs.
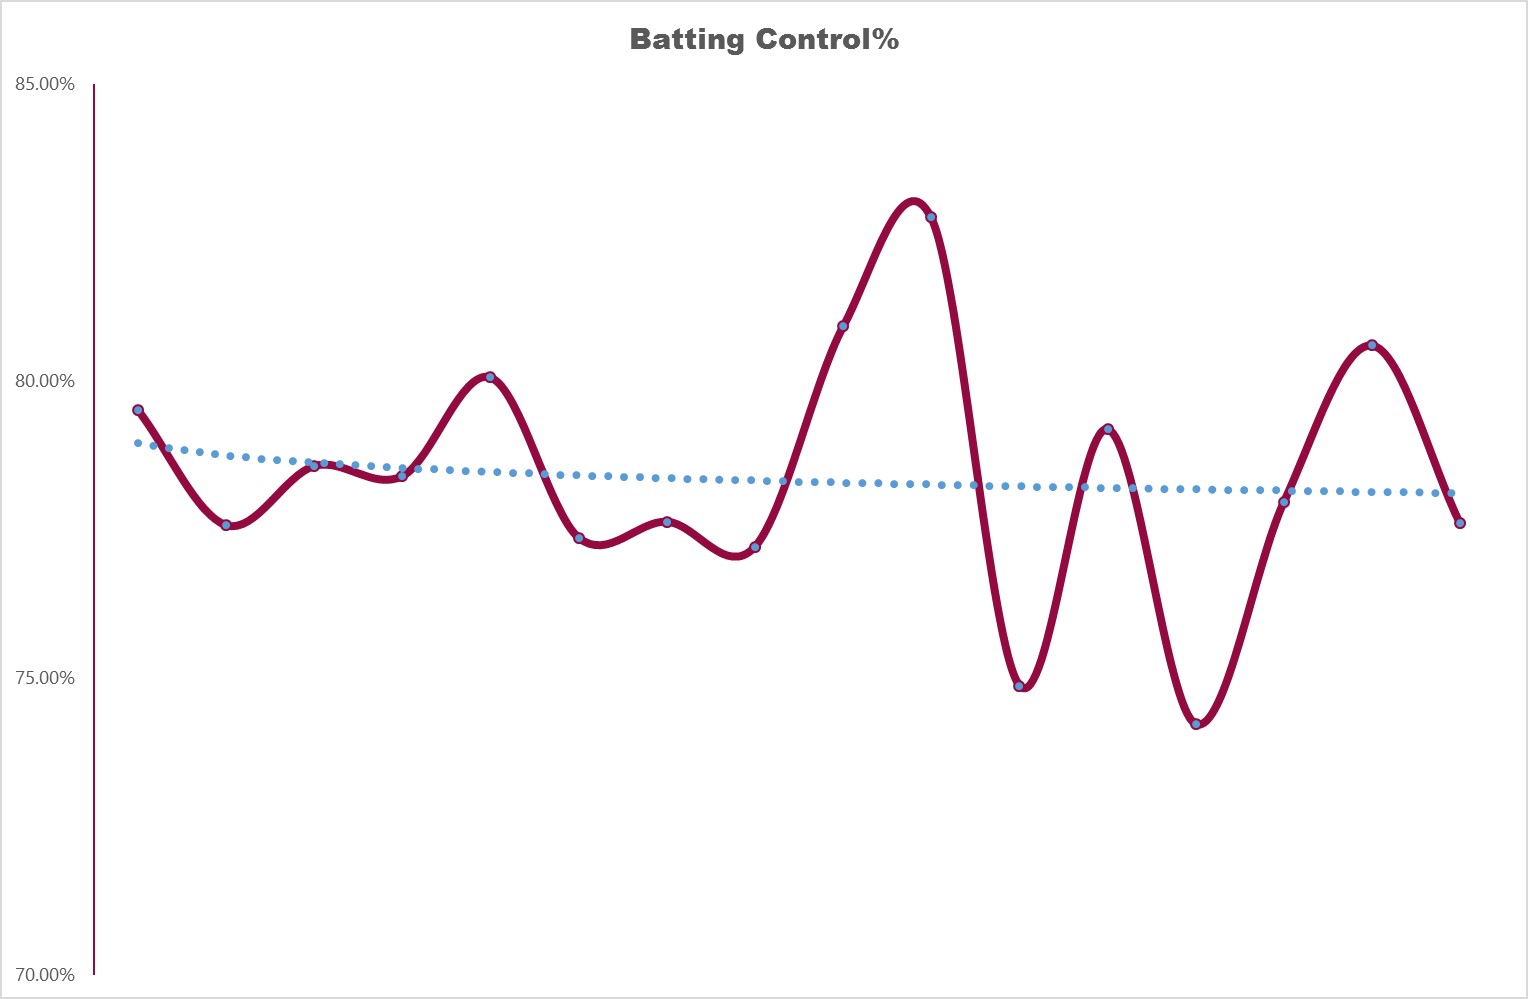
- When batting first, BC was about the same: 78.12%.
- It rose to 79.14% when batting second.
- At home BC was 78.51%
- Away it was 78.26%.
That's remarkably consistent across the different types of game situations.
Next, let's compare BC to other elements.
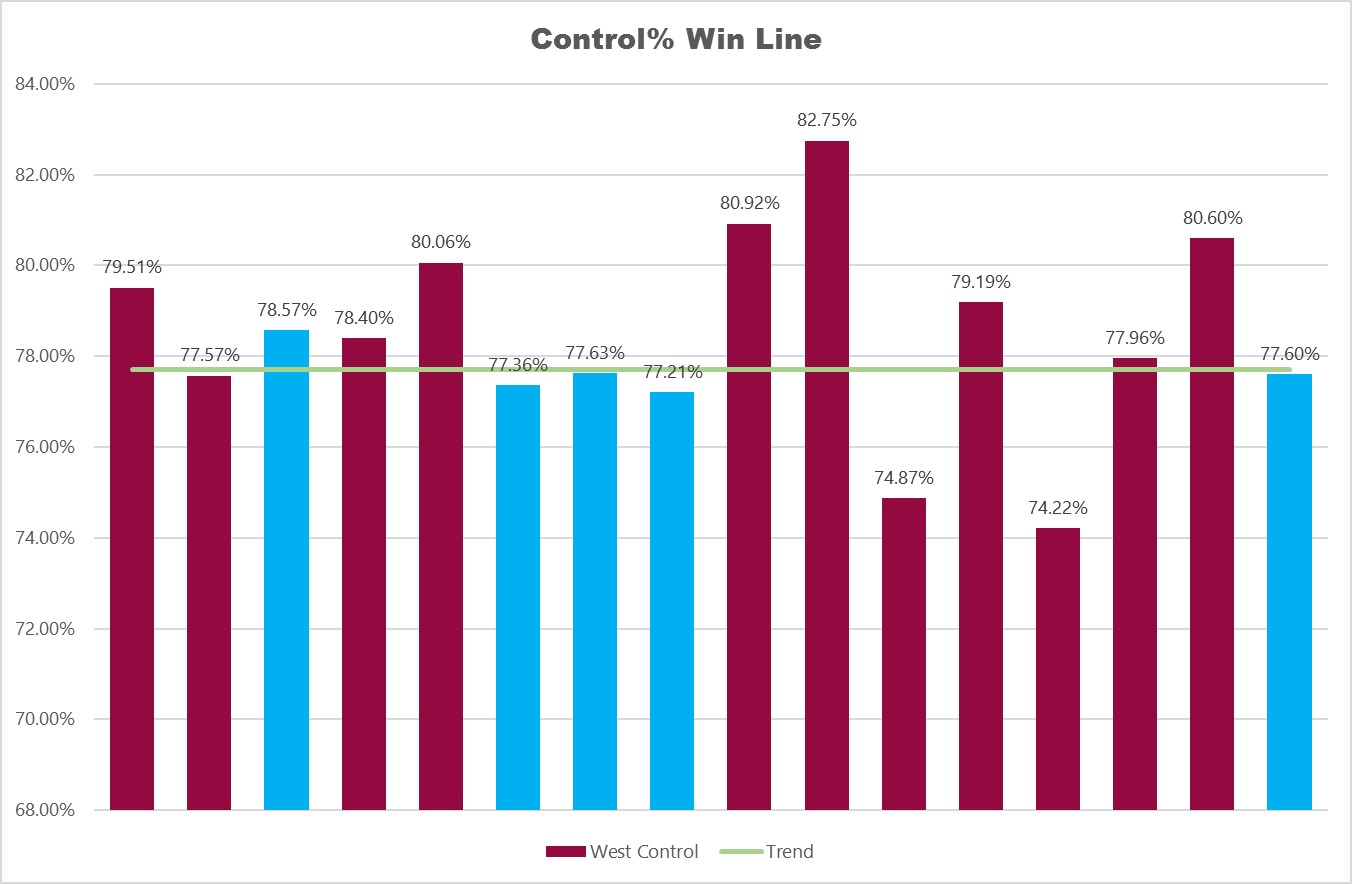
The obvious comparison is results. Does better BC mean wins? According to this set of data, yes it does make a difference. When control is above 77.7% - the green line on the graph above - the team won eight from 10. Below 77.7% and there were three wins from six. You can see the losses on the graph as blue bars. Wins are maroon bars. So, while this stat is not a certainty, there is clearly a difference on show.
Next, does control track to scores?
Here there is also link:
- Batting first (because there is no target) the average score was 159.
- When BC was above average, the average score rose to 170.
- When BC was below average the score fell to 151.
- However, the highest recorded score was 239 with a below average control (77.36%).
- Additionally, the lowest score with an above average BC was 132 (80.60%).
This shows the trend is not a guarantee in individual games.
When we look at wickets taken by the bowlers, we can see a huge drop in opposition control. When the team take 10 wickets, opposing BC is 71%. The opposite way round (team bowled out by opposition) sees control at 77%; not as bad but still a noticeable drop.
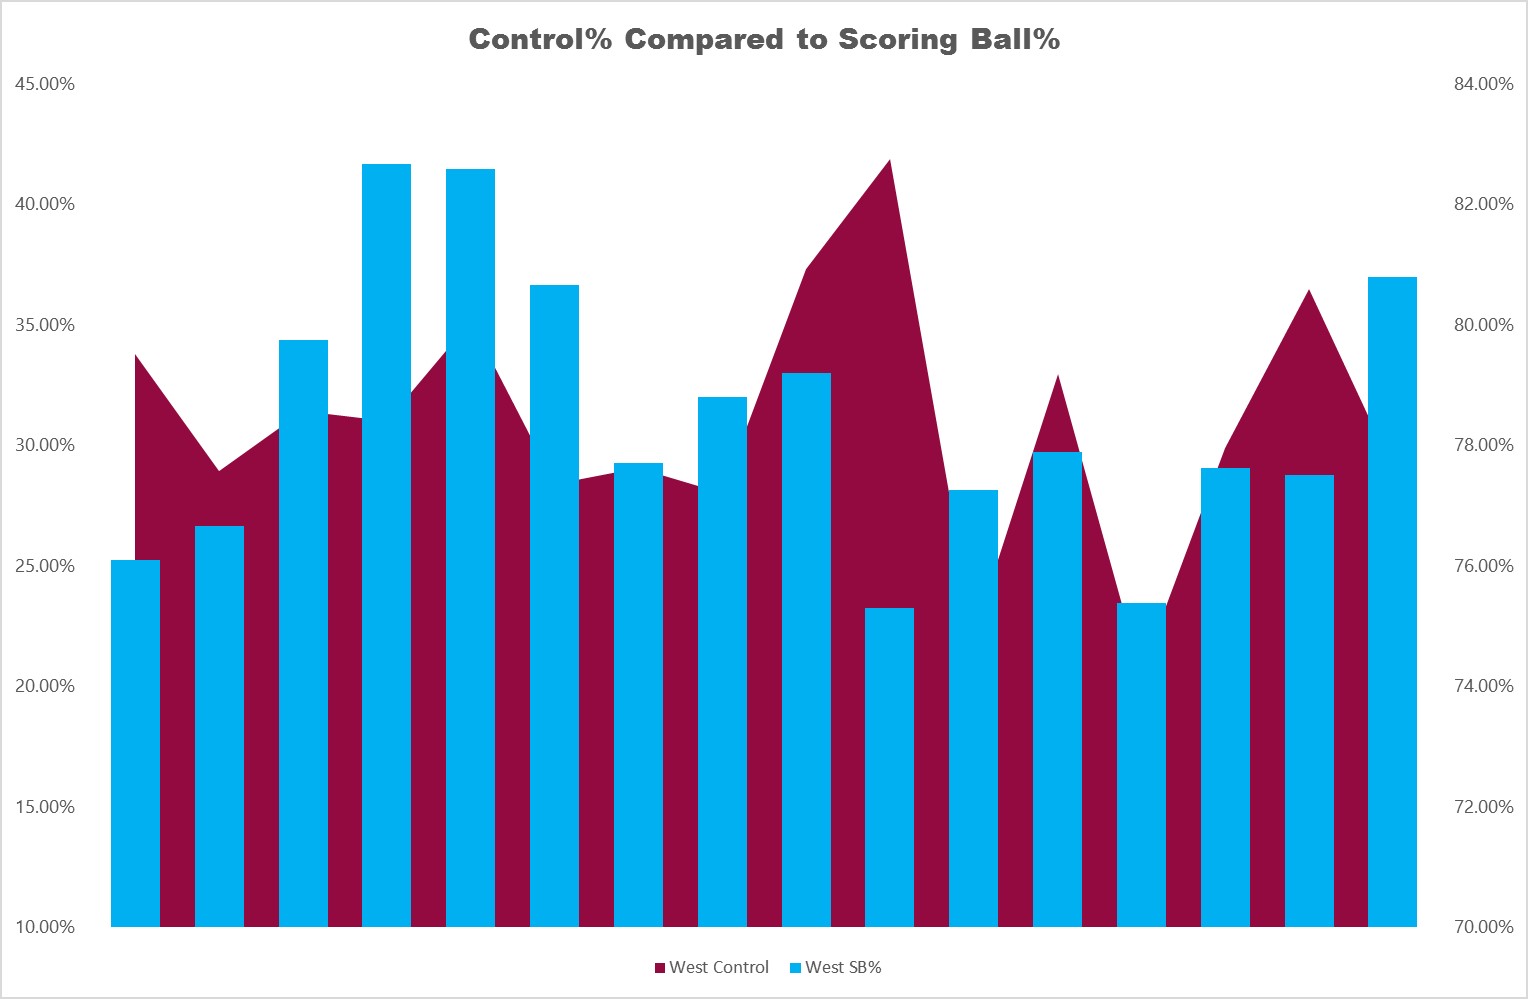
For other comparisons, there could be no relationship found between BC and any of boundaries scored, singles scored or Scoring Ball Percentage (SB%):
What do the results tell us?
First, it's good to see a benchmark for BC. Before this year, we just didn't know what a "good" BC was. Now we can see it's a very small range: 74-81% is a variation of only 7% across over 4000 balls received by the batsmen.
We have also seen there are no glaring facts that control reveals. However, the key point is the better your control when batting, the more runs you get and the more games you win.
This is perhaps obvious, but it's good to be able to get more detail on exactly what that means:
- If you control over 78% of balls, regardless of the runs that come off each ball, you are much more likely to win.
- Every 1% of BC you can improve will get you, on average, five more runs per innings, but every 1% below average costs you 10 runs.
BC as a stat also reduces the cost of wickets to the psychology of a team. That's because wickets can only ever make up 10 deliveries from a possible 300. Even if you are all out, the most your control can drop from wickets is 3.33%.
Of course, wickets are still crucially important, but knowing they are a small part of the overall BC picture makes it easier to realise it's fine to use batsmen as 11 resources who will get out 96% of the time. Your job as batsman is to look to be in control for as many balls as possible while you are at the crease. In other words, thrive rather than just survive.
Finally, BC works best when combined with other stats to get a feel for the game.
- High BC combined with high singles scored and high SB% (above 33%) shows a team who can rotate the strike well, even if overall score is low.
- Low BC combined with high boundaries scored and lower SB% suggests a team that likes to attack the boundary more than defend.
Using this information, you can put together a profile for the way your team bat, the work on developing your tactics.
In this team's case, overall control was both consistent and higher than the opposition through the season. However, there were larger fluctuations in SB% (23-41%) and singles (9-28%). Meanwhile, boundaries were consistently around the 5% mark. This tells me that the strike rotation was patchy, but there were no issues with players defensive or boundary hitting capabilities.
So in this case with this team, The conclusion is that they need to adjust net practice to work more on scoring from more balls consistently. The aim at training should be to push the boundary and control percentage further, while also developing consistency in scoring singles.
Looking back on this experiment, I would recommend using the control statistic with your club or school so you have data to back up your hunches. It's not as vital as runs and wickets of course, but it has helped me build a better picture of the side in games than scores alone.
Judging by this year, I think it can help you too.
- Login to post comments
